Introduction to Digital Camera Sensors
Ok, I’ll be upfront about this lesson. It’s a little technical and some might find it boring, so I’ll try to keep to the basics and give you enough knowledge to be useful to your photography. Having an understanding about your camera and how it processes an image can help you learn the limitations and other factors that affect your photos.
Pixels
Lets start with the basics. By now almost everyone has heard the word “Pixel” and likely has some idea of what it refers to. A photo might have a size of 3000 x 2000 pixels. All this means is that the images is made of dots – 3000 columns of 2000 rows for a total of 6,000,000 pixels or 6mp / 6 megapixels. If you have two images taken with the same exposure, sharp focus and other factors with one image being 300 x 200 pixels and the other one being 3000 x 2000 pixels, the image with the larger number of pixels can be displayed larger, printed larger and even cropped down to a smaller image and still be much sharper than the 300 x 200.
But what exactly IS a pixel? Have a look at the photo below (click to view larger) and see that I have enlarged a small section of it.
If you look at it closely, you’ll see that Sadie’s eye is made of a number of coloured square dots. Each dot is a separate pixel and is a single colour.
Even the “white” highlight in her eye is actually made of a few different colours, look at the different shades of brown for her eye colour and the various shades of grey that make up her fur. Each pixel has its own unique colour and is based on different values of Red, Green and Blue (RGB).
Why does this matter to a photographer who is just starting out and wanting to take better photos? The biggest thing to know at this point is that each pixel can records a value from 0 to 255 in each of the red, green and blue channels. A value of 0, 0, 0 in a pixel would show black. A value of 255, 255, 255 would show white. A value of 255, 0, 0 would show red. It’s a simple system but it has its limits.
When you overexpose part of a photo, it means that you have let too much light onto the sensor that it can only record up to the max value of 255. Once you have recorded a pure white on a pixel, you can not adjust it later in Photoshop, other than making it a shade of grey.
The same applies to when you under expose part of the photo. When not enough light hits the sensor, you get black (0,0,0). Now you can only try to brighten up the black to be grey.
Sometimes when you shoot a scene, you can’t help but either under or over expose part of the image. In those cases you want to get the best exposure on the most important part of the scene. Think of taking a portrait of a friend out in the snow. If their face is in the shadows, you have try to get their face brighter, which in turn will overexpose the white snow. Of course you can use other methods to balance the light, like using a flash – but for now, we’re just thinking about how the digital camera sensors responds to very bright or very dark light.
Dynamic Range
Dynamic range is a term you may have heard and what it refers to is the range of tones from pure black to pure white that the sensor can record. This is usually given a value such as “12 stops of dynamic range” (note that this is different than an “f-stop”). But it does refer to the same exposure stops that I’ve referenced in previous tutorials (1/2 second shutter speed lets in one more stop of light than 1/4s).
For reference a top DSLR may have about 14 stops of dynamic range. The human eye can see about 24 stops as it rapidly changes its pupil and the brain analyzes all the information. When exposing a scene, you need to be aware that your eye is a MUCH better tool for seeing the wide range of shadows and highlights than your camera.
Here’s a look at 11 stops of dynamic range (grayscale) to give you an idea of the variations between full black and full white. the RGB value for each area is given.

If you have a decent monitor, you should be able to see a difference between each stop. Here is the same range (0,0,0 to 255,255,255) in one smooth gradient.

Again, you should be able to see a nice smooth gradient from one extreme to the next. Many cameras and devices will handle the grey colours easily. Let’s have a look at the reds.

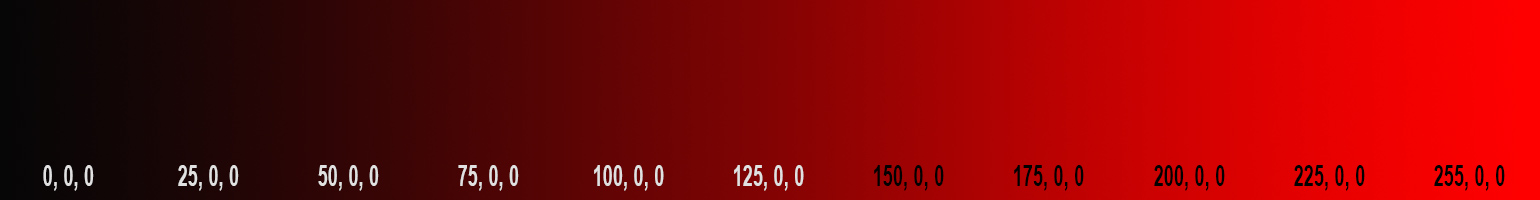
As you can see, it’s just numbers that represent each pixel. Notice how the values have changed only in the first (RGB) with the red value going from 0 to 255, while the blue and green stay at zero (no value).
Finally, here is a look at gradients in grey, red, green and blue. Now you can start to imagine the near infinite colours that we can work with in the digital colour space.

Dynamic Range is really just a way for us to compare one camera sensor to another and to our eyes. We also use it to examine the scene we are shooting. If we get a scene with a dynamic range that is too wide for our camera to record, we will have details lost in the dark shadows and / or overexposed (blown) highlights. At this point, you just want to be aware that your camera will not always record the wide range of colours and brightness in every scene. You need to decide what part of the scene is important and make an exposure based on that. You can read about the “Zone System” of photography to learn more.
Colour Space
Now you know that your digital camera sensor will record a scene that is made up of pixels and each pixel has an RGB value. It would be simple if we only had to deal with one kind of RGB. But I’m here to tell you that life isn’t simple.
When I set up my camera, and have the many options I mentioned in an earlier tutorial, I can select the “Colour Space” that I want the camera to record with. My D800e (like many other cameras) allows me to choose between Adobe RGB and sRGB. What is the difference? In short, Adobe RGB captures a wider range of colour than sRGB, and neither captures the full visible light spectrum.
In the diagram below, you can see the full spectrum of RGB colour overlaid with triangles that show how much of that spectrum can be used by each RGB system.
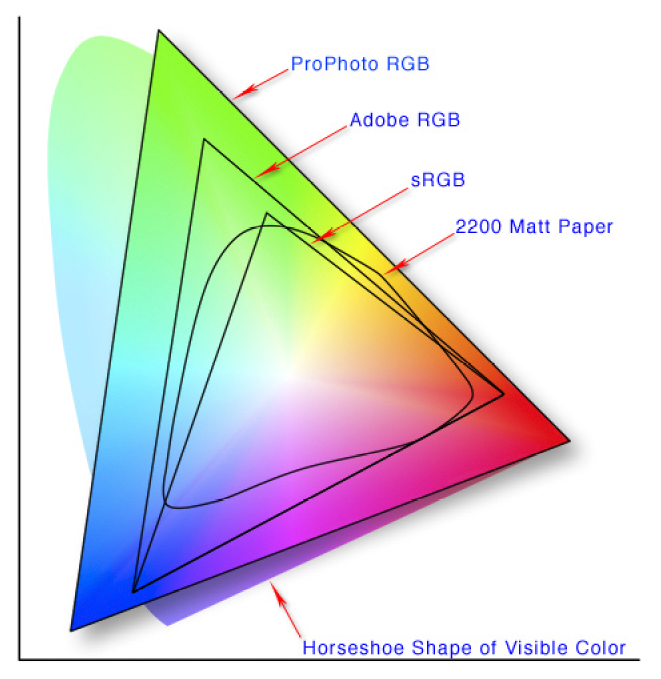
Note there is a ProPhoto RGB that covers most of it, followed by Adobe RGB, followed by sRGB. Also included is a representation of the spectrum that a standard matte paper can print.
The obvious choice would be to set the camera to Adobe RGB as that gives me the most colours. On the other hand, most web browsers work better with sRGB, so if most of my photos go on the web, maybe I should set it to sRGB to save some confusion.

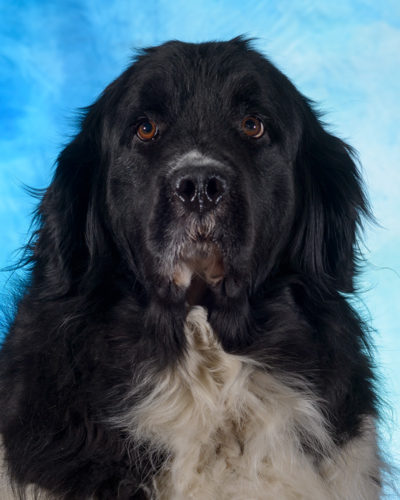
Above are examples of the same photo. The left photo is saved from Photoshop as Adobe RGB, while the one on the right was converted to sRGB when I saved it.
In Firefox, with colour management turned on, the sRGB image looks closest to the real thing.
A good general rule is to save any ‘web’ images as sRGB as that will give the best results to the widest range of users.
Now that you have a colour space for web, what about other uses? If you upload your images to an online photo lab, they will request that you use a certain colour space. If you’re not sure which on to use, contact their support team and find out. It will make a huge difference in how your prints looks when you get them back.
This is just a short introduction to colour space to get you started. You can decide for yourself how far down this rabbit hole your choose to go!
Digital Camera Sensors and the Reality of your Photo
Ok – now that I have gone down a few different paths and not really talked about the digital camera sensor and how it may or may not make your photo look great, it’s time to look into that!
So you now know that your camera may be able to record in different colour spaces (Adobe RGB / sRGB) and it has a limited dynamic range compared to what your eye sees. You need to know how this affects your photo and most importantly – what you can do about it.
Thankfully, DSLRs and many other cameras give you a preview of the photo after you take the shot. It can also show what is called a “Histogram”. This is a graph that shows the exposure of the image and is the easiest way of determining if your exposure is ‘good’. Again, this will only be an introductory guide to reading histograms, but it may be very useful when you are starting out.
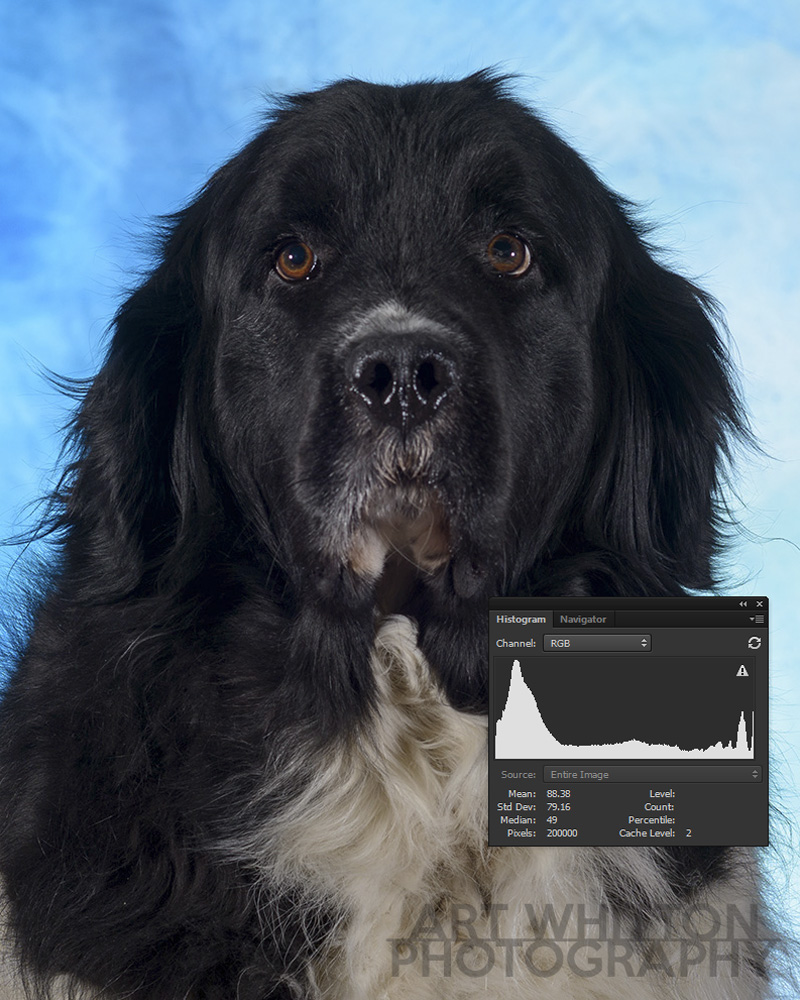
Here is a look at my photo of Sadie with the histogram showing. Click on it to see it larger if you need to.
A histogram shows the values of the exposure in the image. As you see in this photo, there is a peak towards this left. The left side represents the darker colours. You’ll also see a small peak towards the right. The right side represents the lighter colours. Every photo will have a different histogram.
In this photo, I have a dog that is mostly black with some white patches. Does it make sense why there is a larger peak for the dark area (left) and a smaller peak for the bright area (right)? The middle tones by comparison are lower and don’t really have the same peak.
In simple terms, the histogram is your digital camera sensor talking to you and letting you know how you both did on exposing the image.
Here are two very different photos with two very different histograms. The reason I’m showing you these is because there is no ‘perfect’ histogram to try to achieve. The first one is a dark night sky, but still very well exposed.

As you would expect, the bulk of the graph is on the left. Now look at this photo from White Sands New Mexico.

Again, as we should expect, the bulk of the graph is towards the right due to the large bright area. These are two extreme examples, but it’s good to start seeing what the histogram is and how it relates to how your digital camera sensor captured the image. How about a regular scene? What should the histogram look like? There is no ‘perfect’ answer, but have a look at this photo below.

What you see is a histogram that shows the full range of exposure from the black windows to the white doors. I’ve added in the ‘info’ panel to show that in the door area, there are pixels that are ‘blown out’ at 255, 255, 255 (see how this all ties together?). This can also been seen by the graph filling up the right side of the histogram.
Through the magic of Photoshop, I’ve made this photo look like it was underexposed in the camera. Now have a look at the histogram.
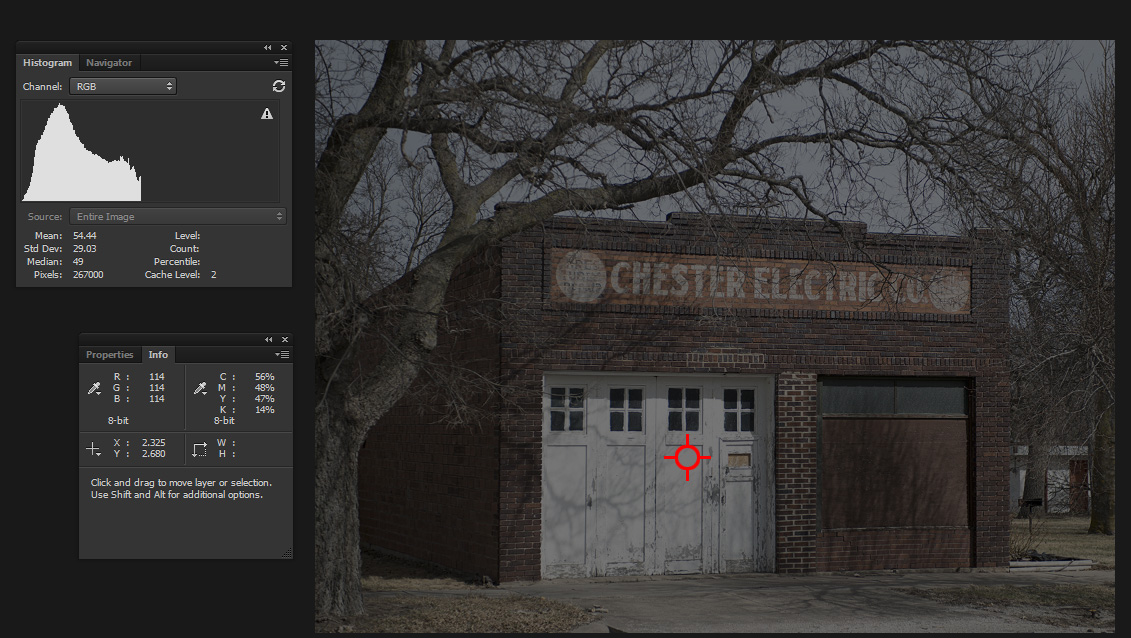
See how the graph is all on the left side now? The RGB value on the ‘bright’ part of the door is now (114, 114, 114). If I shot this photo and looked at the histogram on my camera right away, I would say “Wow – I sure underexposed that one!! I better re-shoot it with a higher exposure.”

Ok – just by looking at the histogram, you can see that the image is overexposed. You know there are some dark areas in the scene, but there is no part of the graph that would indicate a black area. Of course the door is now totally overexposed and the image is washed out.
Here’s a look at how histograms can be used in the real world to get better exposures. The video below shows the back of a camera and shows what you might be able to look at during the image review.
The biggest takeaway from that video is that you can use your available tools in your camera to help you get better exposure. But remember that when you read a histogram you need to consider the scene as well.
Summary
This might have been a long lesson about the technical part of digital camera sensors and how they capture the image, but I feel it’s a valuable one. The more you understand about the digital process from the mechanics of your camera (aperture, shutter speed) to the electronics (sensor, metering) the better you will know how to adapt your settings to get the best photos possible.
If you want to improve your photography and how it is presented, learn about colour space, calibrate your monitor and start getting more self-critical when it comes to colour and exposure.
The next lesson will discuss how the camera will use its built in meter to help you get the best exposure.